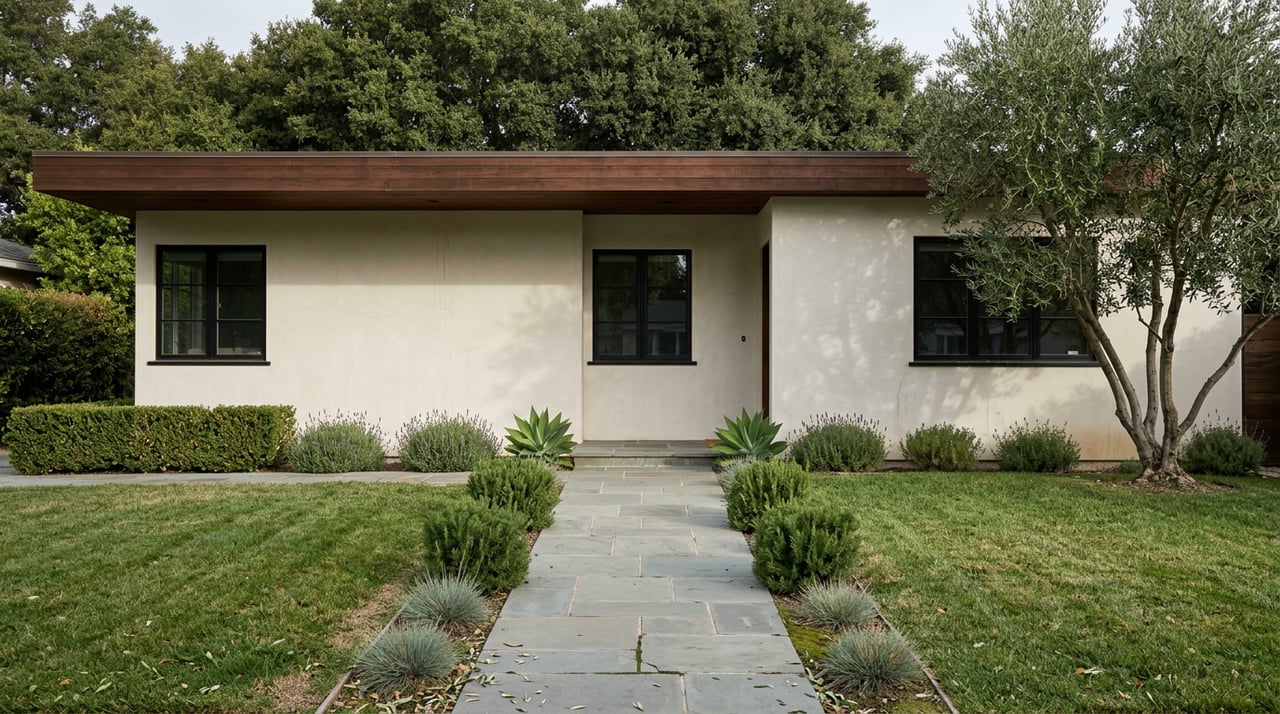
In May 2026, the least expensive home sale recorded in the city of Santa Barbara was a house on W. Ortega Street that closed at $612,500. The same month, the most expensive sale in the city was a house on Roble Lane that closed at $5,770,000. Same city, same 31 days, a spread of more than nine times between the two closings.
That's not a fluke month. It's the ordinary shape of this market. And it's why the single "Santa Barbara median home price" you keep seeing quoted online is doing something closer to averaging apples with orchards than describing an actual neighborhood you could buy into.
One City, Selling at Wildly Different Prices
Santa Barbara doesn't have a housing market so much as it has several housing markets stapled together under one zip code range. Local price data groups them into rough tiers, and the gap between the bottom and top tier is larger than the median price of most American cities on its own.
At the accessible end sit Eastside, Westside, and Oak Park, generally landing in the $1.3 million to $1.6 million range. Eastside's housing stock leans toward Craftsman homes, bungalows, and duplexes near shopping and employment centers, which keeps its median closer to $1.3 million. Westside mixes in more duplexes and multi-family properties, which pulls its median toward roughly $1.4 million.
The middle tier, running about $1.7 million to $2.8 million, covers Downtown, San Roque, and Mesa or West Mesa. San Roque brings tree-lined streets and classic architecture near Upper State Street. Mesa trades that inland feel for bluff walks at Shoreline Park and the Douglas Family Preserve, plus a shorter drive to Arroyo Burro Beach.
At the top, Riviera, Lower Riviera, Upper East, and parts of West Beach regularly clear $2.9 million. This is the hillside tier, where winding streets climb above the flats near the Old Mission and Mission Canyon, and where homes with a view corridor are farther from State Street's walkable core.
| Tier | Typical range | Neighborhoods | What anchors it |
|---|---|---|---|
| Accessible | $1.3M–$1.6M | Eastside, Westside, Oak Park | Craftsman bungalows, duplexes, proximity to employment centers |
| Mid | $1.7M–$2.8M | Downtown, San Roque, Mesa/West Mesa | Upper State Street charm, Shoreline Park bluffs, Douglas Family Preserve |
| Premium | $2.9M+ | Riviera, Lower Riviera, Upper East, parts of West Beach | Hillside views, Mission Canyon, larger lots |
None of these are hard boundaries. They're a starting framework for comparing submarkets that actually compete with each other, which a single citywide number never does.
The Median Depends on Who's Counting and What Window They're Using
Ask different sources for Santa Barbara's median home price and you'll get different answers because they use different time windows. Over the three months ending May 2026, one widely used index put the city's median sale price at $1.9 million, down 9.1 percent year over year. A separate rolling six-month tracker measured through August 2026 put the median closing price at $1.8 million, with the middle half of all sales closing between $1,287,500 and $3,368,000. That $2.08 million gap between the quartiles is wider than the entire median of most coastal cities, and it's the real story: a Mesa bungalow, an Eastside condo, and a Montecito-adjacent estate all land in the same six-month sample.
The gap gets wider once you compare sold prices to asking prices. A sold-price median tells you what buyers actually paid. A list-price median tells you where sellers started, which in Santa Barbara has run noticeably higher than what closes. Neither number is wrong. They're measuring different stages of the same transaction, which is exactly why the same city can generate headlines a million dollars apart depending on which stage a given report is describing.
Why a Citywide Median Can Hide Different Markets
A citywide median blends sales from different price tiers. If you're comparing your own target price range against "the Santa Barbara market," the median may combine tiers you may or may not be shopping in. It doesn't describe your actual transaction unless you already know which tier you're standing in.
The Santa Barbara Association of Realtors makes a related point in its own reporting: shifts in the median are not a signal that any individual home gained or lost value. They reflect which mix of homes happened to sell that period, nothing more.
What This Actually Means If You're Pricing a Home
Once you know which tier you're shopping in, the more useful number isn't the median at all. It's the sale-to-list ratio, because it tells you how much room exists between what a seller asks and what a buyer actually pays in that specific submarket. Citywide, Santa Barbara has been running close to 97 to 98 percent of list. But that number splits by neighborhood. Westside and Eastside have been trading close to 100 percent of list, meaning well-priced homes there are closing at or near asking with little negotiating room. Downtown has been trading a bit below list, and West Downtown closer to 95 percent, which signals buyers there currently have more leverage to negotiate off the asking price.
Downtown's softer ratio is also worth watching for a reason that has nothing to do with pricing models. In April 2026, the Santa Barbara City Council advanced the draft State Street Master Plan, a pedestrian-first redesign of the 400 through 1300 blocks estimated at roughly $48 million to $64 million across the full stretch, to be rolled out in three phases over the coming years. Multi-year construction and reconfiguration projects tend to soften buyer appetite in the immediate footprint while they're underway, which lines up with Downtown's current below-list pattern more than a citywide median ever would.
If you're comparing a specific address against "the market," the useful question isn't what Santa Barbara's median is this month. It's what the sale-to-list ratio looks like on that block, what tier the comps actually sit in, and whether anything nearby, like a multi-year infrastructure project, is quietly shaping how sellers there are pricing right now. For a deeper look at how this plays out at the closing table, our guide on Santa Barbara buyer closing costs walks through what these tier differences mean once you're under contract.
A Few Questions Worth Asking Before You Trust Any Number
Which median should I actually use when comparing listings? The one that matches the property's submarket, not the citywide figure. A Riviera comp is meaningless against an Eastside listing, even though both technically sit inside "Santa Barbara."
Why can a citywide median differ from a particular neighborhood's market? Because the citywide figure blends sales across different tiers, while the relevant comparison is within the property's own submarket.
Does the citywide number matter at all? Mostly as a backdrop for direction, whether the broader market is loosening or tightening, not as a valuation tool for any specific home. The property, the block, and the sale-to-list ratio in that specific submarket carry the real signal.
If you're trying to figure out which Santa Barbara tier actually fits your search, or what a specific address is worth against real comps rather than a citywide average, Sharp Ramsey Group can walk you through the numbers block by block. Browse current listings across Santa Barbara's neighborhoods, or request a free home valuation to see where your own property actually sits in this market.